AWS End-to-End Data Engineering Project
In this project, you’ll build an automated AWS pipeline that collects hourly air quality readings from OpenAQ sensors, calculates the Air Quality Index, and shows it on a dashboard that updates itself every hour.
Prerequisites
- An AWS account. Create a budget alert (for example $5) in AWS Billing before you build anything, and work from an IAM user or role rather than the root account.
- Basic Python and SQL. You'll read and edit a Lambda function, write Athena queries, and adapt a PySpark script in Glue.
- Familiarity with the AWS console. You should be comfortable creating S3 buckets and IAM roles, and reading CloudWatch logs when something fails.
- A single AWS region. I used us-east-1 for every service, which avoids cross-region permission problems.
- A small budget and time to clean up. The Glue job is the main cost, roughly $1 a day if it runs hourly. Disable the schedule and delete the resources when you finish.
- A few hours. Most of the time goes into IAM permissions and debugging, not writing code.
Services
- S3: To store raw/processed data and Athena query results, and to host our dashboard.
- Secrets Manager: To store our API key.
- Lambda: To retrieve data from OpenAQ using our API key.
- Glue: To process data using a Python notebook.
- Athena: To query data in S3.
- Step Functions: To orchestrate the pipeline.
- EventBridge: To automate the pipeline.
- CloudFront: To securely deliver and cache the S3-hosted dashboard globally.
Steps
- Create three S3 buckets: One for raw data, one for processed data, and one for the dashboard.
- Get an API_KEY:
Sign up here: https://explore.openaq.org/register. Go to your newly created account. Under Settings, you will find your API_KEY.
- Create a Secret in Secrets Manager:
Go to AWS Secrets Manager > Store a new secret, choose Other type of secret. Under the Plaintext tab, only write your API_KEY, click Next, give your Secret a name, click Next and finally Store.
- Create a lambda function:
Go to Configuration and change timeout value from 3s to 90s. Under the Permissions tab, click the execution role. Click Add permissions and add these two one by one:
— Attach policies: AmazonS3FullAccess
— Create inline policy:
    {
        "Version": "2012-10-17",
        "Statement": [
            {
                "Effect": "Allow",
                "Action": "secretsmanager:GetSecretValue",
                "Resource": "YOUR_SECRET_ARN"
            }
        ]
    }
Replace YOUR_SECRET_ARN. You can find it in your Secret’s details. Next, we will add two layers for our lambda function.
— One for the OpenAQ Python SDK. In your local terminal, run the following commands:
Note: Our Lambda code does not use openaq Python SDK anymore, but I did not remove the tutorial in case you might need it in the future.
    mkdir -p python
    pip install openaq -t python/
    zip -r openaq-layer.zip python/
Go to Lambda > Layers > Create Layer. Upload the zip file and save.
— One for the Secrets Manager. Scroll down in while you are in the Code tab. Click the Edit button next to Layers. Add a layer > AWS Layers > AWS-Parameters-and-Secrets-Lambda-Extension. Choose a version and Add > Save.
Finally, here is our Lambda code that extracts raw data from OpenAQ:
    import boto3
    import urllib.request
    import urllib.parse
    import urllib.error
    import json
    import time
    import logging
    from collections import defaultdict
    from datetime import datetime, timedelta, timezone

    logger = logging.getLogger()
    logger.setLevel(logging.INFO)

    SECRET_NAME = "YOUR_SECRET_NAME"
    REGION = "us-east-1"

    BUCKET = "YOUR_RAW_BUCKET_NAME"
    PREFIX = "openaq"

    SENSOR_IDS = [10828957, 10828958, 10828959, 11293992, 11293993]

    BASE_URL = "https://api.openaq.org/v3"
    DAYS_BACK = 7
    PAGE_SIZE = 1000
    MAX_PAGES = 10

    s3 = boto3.client("s3")
    secrets = boto3.client("secretsmanager", region_name=REGION)

    _api_key = None


    def get_api_key():
        global _api_key
        if _api_key is None:
            response = secrets.get_secret_value(SecretId=SECRET_NAME)
            _api_key = response["SecretString"].strip()
        return _api_key


    def fetch(api_key, path, params, retries=3):
        url = f"{BASE_URL}{path}?{urllib.parse.urlencode(params)}"
        req = urllib.request.Request(url, headers={"X-API-Key": api_key})

        for attempt in range(retries):
            try:
                with urllib.request.urlopen(req, timeout=30) as response:
                    return json.loads(response.read().decode("utf-8"))
            except urllib.error.HTTPError as e:
                if e.code == 429 and attempt < retries - 1:
                    time.sleep(2 ** attempt * 5)   # back off when rate limited
                    continue
                raise


    def get_sensor_measurements(api_key, sensor_id, datetime_from, datetime_to):
        records = []
        for page in range(1, MAX_PAGES + 1):
            data = fetch(
                api_key,
                f"/sensors/{sensor_id}/measurements",
                {
                    "datetime_from": datetime_from,
                    "datetime_to": datetime_to,
                    "limit": PAGE_SIZE,
                    "page": page,
                },
            )
            results = data.get("results", [])
            for item in results:
                item["sensor_id"] = sensor_id   # tag so sensors can be told apart downstream
            records.extend(results)

            if len(results) < PAGE_SIZE:
                break
            time.sleep(1)
        return records


    def lambda_handler(event, context):
        api_key = get_api_key()

        # Window: midnight UTC 7 days ago -> now
        now = datetime.now(timezone.utc)
        start = (now - timedelta(days=DAYS_BACK)).replace(hour=0, minute=0, second=0, microsecond=0)
        fmt = "%Y-%m-%dT%H:%M:%SZ"
        datetime_from, datetime_to = start.strftime(fmt), now.strftime(fmt)

        records_by_date = defaultdict(list)
        counts = {}

        for sensor_id in SENSOR_IDS:
            records = get_sensor_measurements(api_key, sensor_id, datetime_from, datetime_to)
            counts[sensor_id] = len(records)
            if not records:
                logger.warning("No records returned for sensor %s", sensor_id)

            for r in records:
                day = r["period"]["datetimeFrom"]["utc"][:10]   # e.g. "2026-10-08"
                records_by_date[day].append(r)
            time.sleep(1)  # stay under rate limits

        if not records_by_date:
            raise RuntimeError("OpenAQ returned no data for any sensor; nothing written.")

        # One newline-delimited JSON file per date; re-running overwrites the same files
        for day, records in sorted(records_by_date.items()):
            records.sort(key=lambda r: (r["period"]["datetimeFrom"]["utc"], r["sensor_id"]))
            body = "\n".join(json.dumps(r) for r in records)
            s3.put_object(
                Bucket=BUCKET,
                Key=f"{PREFIX}/date={day}/air_quality.json",
                Body=body.encode("utf-8"),
                ContentType="application/x-ndjson",
            )

        summary = {
            "message": "Air Quality data saved to S3",
            "from": datetime_from,
            "to": datetime_to,
            "files_written": len(records_by_date),
            "records_per_sensor": counts,
            "total_records": sum(counts.values()),
        }
        logger.info(json.dumps(summary))
        return {"statusCode": 200, "body": json.dumps(summary)}
Do NOT forget to update YOUR_SECRET_NAME and YOUR_RAW_BUCKET_NAME parameters. After deploying your code, create a test event and test it. The results will be saved in your S3 bucket.
- Query data in S3 using Athena [Optional]:
Go to S3 and create a bucket to store query results. I have also created a lifecycle rule for this bucket to delete all objects after 2 days.
Go to Amazon Athena > query settings > Manage, choose the newly created bucket as Query result location.
Run the following queries in Athena:
CREATE DATABASE IF NOT EXISTS openaq_db;create a database and choose it from the left panel CREATE EXTERNAL TABLE IF NOT EXISTS openaq_db.air_quality_raw ( sensor_id bigint, value double, parameter struct< id: int, name: string, units: string, displayname: string >, period struct< label: string, `interval`: string, datetimefrom: struct<utc: string, local: string>, datetimeto: struct<utc: string, local: string> > ) ROW FORMAT SERDE 'org.openx.data.jsonserde.JsonSerDe' WITH SERDEPROPERTIES ('ignore.malformed.json' = 'true') LOCATION 's3://YOUR_RAW_BUCKET_NAME/openaq/';create a table using your raw bucket from S3, replace YOUR_RAW_BUCKET_NAME SELECT * FROM openaq_db.air_quality_raw LIMIT 10;example query 1 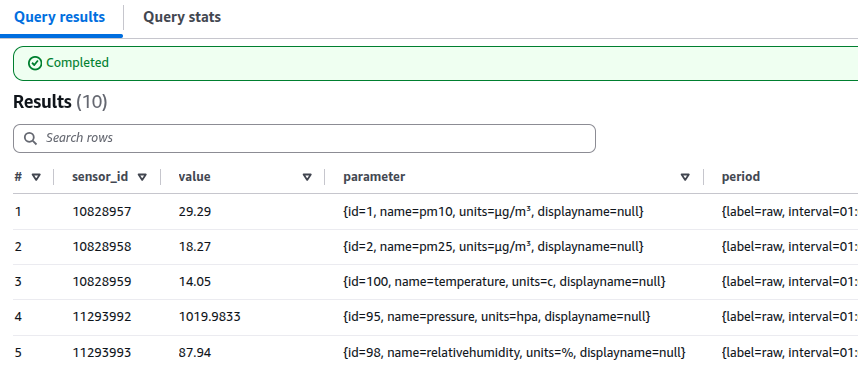
    SELECT
      sensor_id,
      parameter.name AS pollutant,
      value,
      parameter.units AS units,
      from_iso8601_timestamp(period.datetimefrom.utc) AS measured_at
    FROM openaq_db.air_quality_raw
    ORDER BY measured_at DESC
    LIMIT 100;
example query 2 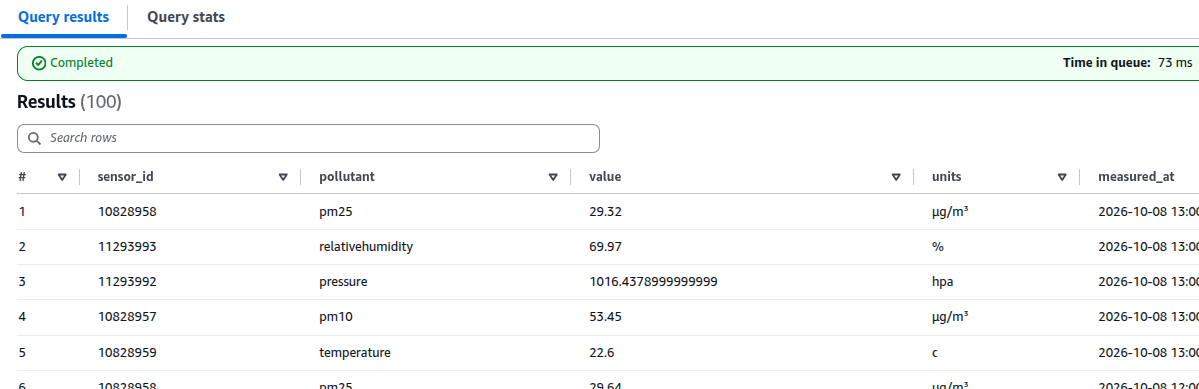
- Create an Amazon Glue notebook: This is the data processing step.
Note: Amazon Glue notebooks charge an hourly fee, so do NOT forget your notebooks running, always stop them when not in use.
    %number_of_workers 2
    %timeout 15
run these magic commands to change Job configuration from pyspark.sql import SparkSession # Initialize a Spark Session spark = SparkSession.builder.appName('openaq_processing').getOrCreate() # Read from S3 bucket data_location = "s3://YOUR_RAW_BUCKET_NAME/openaq/" df = spark.read.json(data_location) df.show(5)read data from S3 from pyspark.sql import Window from pyspark.sql.functions import ( col, udf, when, greatest, avg, count, to_date, to_timestamp, from_utc_timestamp ) from pyspark.sql.types import DoubleType, StringType import math spark.conf.set("spark.sql.session.timeZone", "UTC") # ---------- 1. Flatten + convert to Istanbul local time ---------- flat = df.select( col("value"), col("parameter.name").alias("pollutant"), from_utc_timestamp( to_timestamp(col("period.datetimeFrom.utc")), "Europe/Istanbul" ).alias("measured_at"), ) # ---------- 2. Pivot: one row per local hour ---------- wide = ( flat.groupBy("measured_at") .pivot("pollutant", ["pm10", "pm25", "temperature", "pressure", "relativehumidity"]) .avg("value") ) # ---------- 3. AQI helpers ---------- PM25_BP = [(0.0, 9.0, 0, 50), (9.1, 35.4, 51, 100), (35.5, 55.4, 101, 150), (55.5, 125.4, 151, 200), (125.5, 225.4, 201, 300), (225.5, 325.4, 301, 500)] PM10_BP = [(0, 54, 0, 50), (55, 154, 51, 100), (155, 254, 101, 150), (255, 354, 151, 200), (355, 424, 201, 300), (425, 504, 301, 400), (505, 604, 401, 500)] def sub_index(conc, bps, decimals): if conc is None or conc < 0: return None f = 10 ** decimals c = math.floor(conc * f) / f for c_low, c_high, i_low, i_high in bps: if c_low <= c <= c_high: return float(math.floor((i_high - i_low) / (c_high - c_low) * (c - c_low) + i_low + 0.5)) return 500.0 if c > bps[-1][1] else None def category(aqi): if aqi is None: return None if aqi <= 50: return "Good" if aqi <= 100: return "Moderate" if aqi <= 150: return "Unhealthy for Sensitive Groups" if aqi <= 200: return "Unhealthy" if aqi <= 300: return "Very Unhealthy" return "Hazardous" aqi_pm25 = udf(lambda x: sub_index(x, PM25_BP, 1), DoubleType()) aqi_pm10 = udf(lambda x: sub_index(x, PM10_BP, 0), DoubleType()) aqi_cat = udf(category, StringType()) def add_aqi(d, pm25_col, pm10_col): d = (d.withColumn("aqi_pm25", aqi_pm25(col(pm25_col))) .withColumn("aqi_pm10", aqi_pm10(col(pm10_col)))) # PM2.5 is required: no AQI if it's missing, rather than a misleading PM10-only value d = d.withColumn("aqi", when(col("aqi_pm25").isNotNull(), greatest(col("aqi_pm25"), col("aqi_pm10")))) return d.withColumn("aqi_category", aqi_cat(col("aqi"))) # ---------- 4a. Rolling 24-hour AQI (for "now" and the hourly trend) ---------- w24 = Window.orderBy(col("measured_at").cast("long")).rangeBetween(-23 * 3600, 0) rolling = ( wide.withColumn("pm25_24h", avg("pm25").over(w24)) .withColumn("pm10_24h", avg("pm10").over(w24)) .withColumn("n_pm25", count("pm25").over(w24)) .withColumn("n_pm10", count("pm10").over(w24)) .withColumn("pm25_24h", when(col("n_pm25") >= 18, col("pm25_24h"))) # 75% rule .withColumn("pm10_24h", when(col("n_pm10") >= 18, col("pm10_24h"))) ) hourly = add_aqi(rolling, "pm25_24h", "pm10_24h") # ---------- 4b. Daily AQI (Istanbul calendar days) ---------- daily = ( wide.withColumn("day", to_date(col("measured_at"))) .groupBy("day") .agg(avg("pm25").alias("pm25_avg"), count("pm25").alias("n_pm25"), avg("pm10").alias("pm10_avg"), count("pm10").alias("n_pm10"), avg("temperature").alias("temperature_avg"), avg("relativehumidity").alias("relativehumidity_avg"), avg("pressure").alias("pressure_avg")) .withColumn("pm25_avg", when(col("n_pm25") >= 18, col("pm25_avg"))) .withColumn("pm10_avg", when(col("n_pm10") >= 18, col("pm10_avg"))) ) daily = add_aqi(daily, "pm25_avg", "pm10_avg")process data # ---------- 5. Write ---------- output_location = "s3://YOUR_PROCESSED_BUCKET_NAME/openaq/" hourly.coalesce(1).write.mode("overwrite").parquet(output_location + "hourly/") daily.coalesce(1).write.mode("overwrite").parquet(output_location + "daily/")write processed data to S3 import json, boto3 from pyspark.sql.functions import date_format h = (hourly.orderBy("measured_at") .select(date_format("measured_at", "yyyy-MM-dd'T'HH:mm:ss").alias("measured_at"), "pm25", "pm10", "temperature", "relativehumidity", "pressure", "aqi", "aqi_category")) d = (daily.orderBy("day") .select(col("day").cast("string").alias("day"), "pm25_avg", "pm10_avg", "aqi", "aqi_category")) payload = {"hourly": [json.loads(r) for r in h.toJSON().collect()], "daily": [json.loads(r) for r in d.toJSON().collect()]} boto3.client("s3").put_object( Bucket="YOUR_DASHBOARD_BUCKET_NAME", Key="data.json", Body=json.dumps(payload).encode("utf-8"), ContentType="application/json", CacheControl="max-age=300" )update data.json for our dashboard You can view your processed data using Athena:
    CREATE EXTERNAL TABLE IF NOT EXISTS openaq_db.air_quality_hourly
    (
      measured_at timestamp,
      pm10 double,
      pm25 double,
      temperature double,
      pressure double,
      relativehumidity double,
      pm25_24h double,
      pm10_24h double,
      n_pm25 bigint,
      n_pm10 bigint,
      aqi_pm25 double,
      aqi_pm10 double,
      aqi double,
      aqi_category string
    )
    STORED AS PARQUET
    LOCATION 's3://YOUR_PROCESSED_BUCKET_NAME/openaq/hourly/';
SELECT * FROM openaq_db.air_quality_hourly LIMIT 30;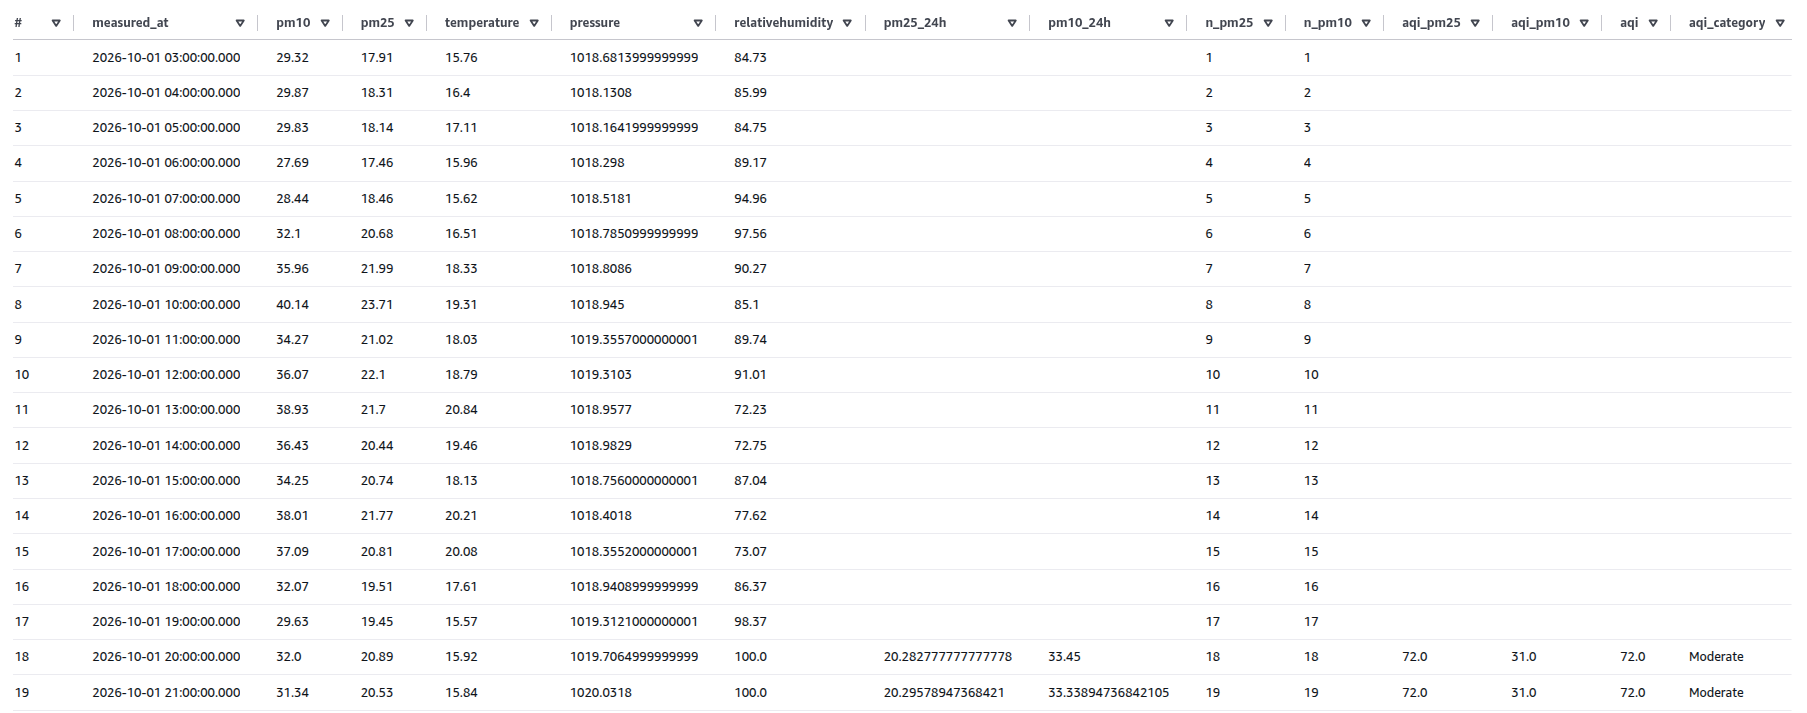
    CREATE EXTERNAL TABLE IF NOT EXISTS openaq_db.air_quality_daily
    (
      day date,
      pm25_avg double,
      n_pm25 bigint,
      pm10_avg double,
      n_pm10 bigint,
      temperature_avg double,
      relativehumidity_avg double,
      pressure_avg double,
      aqi_pm25 double,
      aqi_pm10 double,
      aqi double,
      aqi_category string
    )
    STORED AS PARQUET
    LOCATION 's3://YOUR_PROCESSED_BUCKET_NAME/openaq/daily/';
SELECT * FROM openaq_db.air_quality_daily LIMIT 30;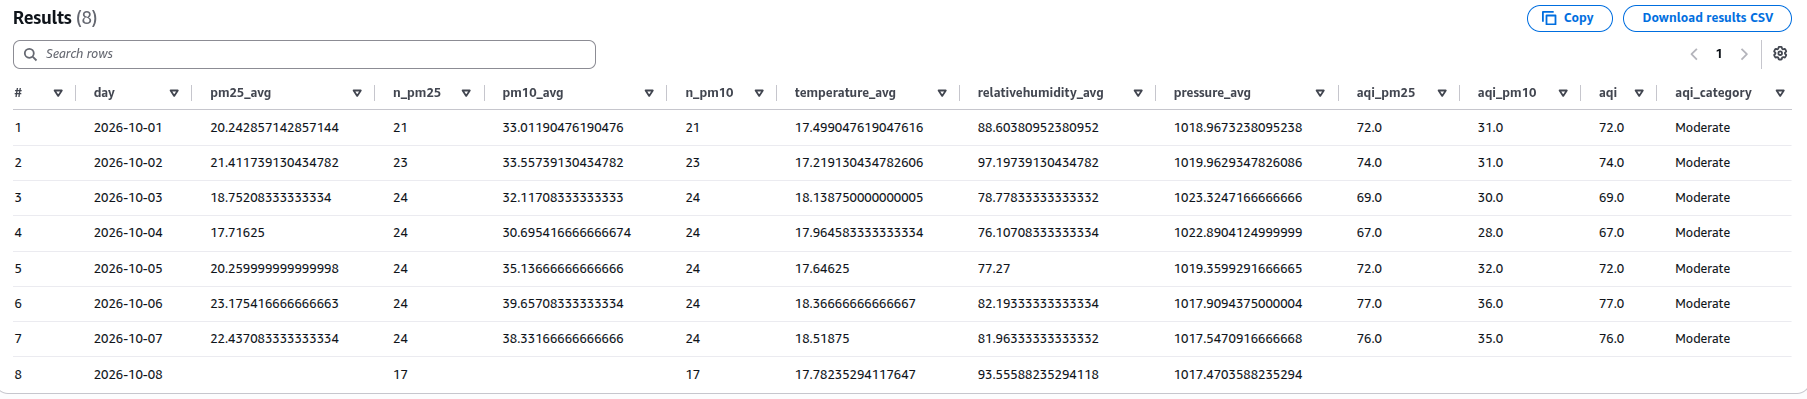
- Create a Topic and a Subscription: In this step, you will define a pub-sub model to receive a notification in the event of a failure on your pipeline.
Go to Simple Notification Service (SNS) > Topics > Create topic. Choose Standard, give your topic the name “openaq-pipeline-alerts” and create. Click Create subscription and choose Email as Protocol. Enter your email and create. Check your mailbox for an email to confirm your subscription.
- Create a State Machine: In this step, you will define your architecture.
Go to Step Functions > State machines > Create state machine. Choose Create from blank and Standard. Give your machine a name and click Continue. Open Code view and paste the following:
    {
      "Comment": "Hourly OpenAQ pipeline: fetch raw data (Lambda), then process it (Glue)",
      "StartAt": "FetchOpenAQData",
      "States": {
        "FetchOpenAQData": {
          "Type": "Task",
          "Resource": "arn:aws:states:::lambda:invoke",
          "Parameters": {
            "FunctionName": "YOUR_LAMBDA_FUNCTION_ARN",
            "Payload": {}
          },
          "ResultPath": "$.lambdaResult",
          "TimeoutSeconds": 180,
          "Retry": [
            {
              "ErrorEquals": ["States.TaskFailed"],
              "IntervalSeconds": 60,
              "MaxAttempts": 2,
              "BackoffRate": 2.0
            }
          ],
          "Catch": [
            {
              "ErrorEquals": ["States.ALL"],
              "ResultPath": "$.error",
              "Next": "NotifyFailure"
            }
          ],
          "Next": "ProcessWithGlue"
        },
        "ProcessWithGlue": {
          "Type": "Task",
          "Resource": "arn:aws:states:::glue:startJobRun.sync",
          "Parameters": {
            "JobName": "YOUR_GLUE_JOB_NAME"
          },
          "ResultPath": "$.glueResult",
          "TimeoutSeconds": 900,
          "Retry": [
            {
              "ErrorEquals": ["States.TaskFailed"],
              "IntervalSeconds": 60,
              "MaxAttempts": 1,
              "BackoffRate": 2.0
            }
          ],
          "Catch": [
            {
              "ErrorEquals": ["States.ALL"],
              "ResultPath": "$.error",
              "Next": "NotifyFailure"
            }
          ],
          "Next": "PipelineSucceeded"
        },
        "NotifyFailure": {
          "Type": "Task",
          "Resource": "arn:aws:states:::sns:publish",
          "Parameters": {
            "TopicArn": "YOUR_TOPIC_ARN",
            "Subject": "OpenAQ pipeline failed",
            "Message.$": "States.JsonToString($.error)"
          },
          "Next": "PipelineFailed"
        },
        "PipelineFailed": {
          "Type": "Fail",
          "Error": "PipelineError",
          "Cause": "Lambda fetch or Glue processing failed. See execution history."
        },
        "PipelineSucceeded": {
          "Type": "Succeed"
        }
      }
    }
Replace the following placeholders: YOUR_LAMBDA_FUNCTION_ARN, YOUR_GLUE_JOB_NAME, YOUR_TOPIC_ARN Under the Config tab, scroll down to Permissions and make sure Create new role is selected. In the same page scroll down to Logging and choose ERROR for the Log level. Finally, click Create. To ensure that it works, manually test it. Click Start execution and wait for everything to turn green.
- Schedule your pipeline using EventBridge: It will run at 15 minutes past every hour (UTC), which gives OpenAQ time to publish the latest readings.
Go to Amazon EventBridge > Schedules > Create schedule. Give your schedule a name. Choose Recurring schedule, Cron-based schedule and use the expression “15 * * * ? *”. Set the Flexible time window Off.
Click Next. For the target, choose Step Functions StartExecution. Choose your state machine and keep input empty ({}). Click Next. Click Next. Finally, Create schedule.
Note: Do NOT forget to disable the schedule after you explored the project. Otherwise, you will be charged a good amount of money for it ($20-$35/monthly).
- Create an index.html file for the dashboard: We will use S3 and CloudFront to host our dashboard.
Load the following index.html to your dashboard S3 bucket.
<!DOCTYPE html>
    <html lang="en">
    <head>
    <meta charset="utf-8">
    <meta name="viewport" content="width=device-width, initial-scale=1">
    <title>Air quality in Kadıköy, İstanbul</title>
    <link rel="preconnect" href="https://fonts.googleapis.com">
    <link rel="preconnect" href="https://fonts.gstatic.com" crossorigin>
    <link href="https://fonts.googleapis.com/css2?family=Bricolage+Grotesque:opsz,wght@12..96,400;600;800&display=swap" rel="stylesheet">
    <script src="https://cdnjs.cloudflare.com/ajax/libs/Chart.js/4.4.1/chart.umd.min.js"></script>
    <style>
    :root{--bg:#f5f7f8;--text:#14181c;--muted:#5d6670;--line:#dde2e6;--c:#8a8f98}
    @media (prefers-color-scheme:dark){:root{--bg:#0e1215;--text:#e9edf0;--muted:#98a2ab;--line:#262d33}}
    *{box-sizing:border-box}
    body{margin:0;background:var(--bg);color:var(--text);font-family:"Bricolage Grotesque",system-ui,-apple-system,"Segoe UI",sans-serif;line-height:1.5}
    .wrap{max-width:1040px;margin:0 auto;padding:0 20px}
    header{background:color-mix(in srgb,var(--c) 22%,var(--bg));border-bottom:1px solid var(--line);padding:24px 0 36px}
    h1{font-size:1.1rem;font-weight:600;margin:0 0 28px}
    .now{display:flex;gap:28px;align-items:center;flex-wrap:wrap}
    .num{font-size:clamp(5rem,16vw,9rem);font-weight:800;line-height:.85;letter-spacing:-.04em;padding-left:20px;border-left:10px solid var(--c)}
    .cat{font-size:clamp(1.5rem,4vw,2.2rem);font-weight:800;letter-spacing:-.01em;line-height:1.1}
    .now p{margin:6px 0 0;max-width:46ch}
    .muted{color:var(--muted);font-size:.9rem}
    .readings{display:grid;grid-template-columns:repeat(auto-fit,minmax(150px,1fr));margin:0;padding:8px 0 0}
    .readings div{padding:20px 16px 20px 0;border-bottom:1px solid var(--line)}
    .readings dt{color:var(--muted);font-size:.9rem}
    .readings dd{margin:2px 0 0;font-size:1.8rem;font-weight:600}
    .readings small{font-size:.9rem;font-weight:400;color:var(--muted)}
    .charts{display:grid;grid-template-columns:repeat(auto-fit,minmax(min(100%,440px),1fr));gap:40px;padding:32px 0}
    h2{font-size:1.05rem;font-weight:600;margin:0 0 12px}
    .box{position:relative;height:280px}
    footer{padding:0 0 48px;max-width:70ch}
    </style>
    </head>
    <body>
    <header id="hero">
      <div class="wrap">
        <h1>Air quality in Kadıköy, İstanbul</h1>
        <div class="now">
          <div class="num" id="aqi">–</div>
          <div>
            <div class="cat" id="cat">Loading data</div>
            <p id="advice"></p>
            <p class="muted" id="when"></p>
          </div>
        </div>
      </div>
    </header>
    <main class="wrap">
      <dl class="readings" id="readings"></dl>
      <section class="charts">
        <div><h2>Today, hour by hour</h2><div class="box"><canvas id="c1"></canvas></div></div>
        <div><h2>Last 7 days</h2><div class="box"><canvas id="c2"></canvas></div><p class="muted" id="note"></p></div>
      </section>
      <footer class="muted">
        Readings come from OpenAQ sensors. The index follows the US EPA method, which averages PM2.5 and PM10 over 24 hours. Times are local (UTC+3).
      </footer>
    </main>
    <script>
    const CATS=[
    [50,'Good','#2fbf5b','Air is clean. A good day to be outside.'],
    [100,'Moderate','#f2c230','Acceptable. Unusually sensitive people may notice symptoms.'],
    [150,'Unhealthy for Sensitive Groups','#f28a30','Sensitive groups should limit long or heavy outdoor exertion.'],
    [200,'Unhealthy','#e5493a','Everyone may feel effects. Reduce heavy outdoor exertion.'],
    [300,'Very Unhealthy','#8f3f97','Avoid outdoor exertion. Sensitive groups should stay indoors.'],
    [Infinity,'Hazardous','#7e0023','Stay indoors and avoid all outdoor activity.']];
    const cat=a=>a==null?null:CATS.find(c=>a<=c[0]);
    const $=id=>document.getElementById(id);
    const num=(v,d)=>v==null?'–':Number(v).toFixed(d);
    const css=n=>getComputedStyle(document.documentElement).getPropertyValue(n).trim();

    function render(d){
      const hourly=d.hourly||[], daily=d.daily||[];
      if(!hourly.length){$('cat').textContent='No data yet';return}
      const last=hourly[hourly.length-1];
      const live=[...hourly].reverse().find(r=>r.aqi!=null);
      const c=cat(live&&live.aqi);

      document.getElementById('hero').style.setProperty('--c',c?c[2]:'#8a8f98');
      $('aqi').textContent=live?Math.round(live.aqi):'–';
      $('cat').textContent=c?c[1]:'Not enough data';
      $('advice').textContent=c?c[3]:'The 24-hour average needs at least 18 hours of readings.';
      $('when').textContent='Rolling 24-hour index. Latest reading '+last.measured_at.replace('T',' ').slice(0,16);

      const tiles=[['PM2.5','pm25','µg/m³',1],['PM10','pm10','µg/m³',1],['Temperature','temperature','°C',1],['Humidity','relativehumidity','%',0],['Pressure','pressure','hPa',0]];
      $('readings').innerHTML=tiles.map(t=>`<div><dt>${t[0]}</dt><dd>${num(last[t[1]],t[3])}<small> ${t[2]}</small></dd></div>`).join('');

      Chart.defaults.color=css('--muted');
      Chart.defaults.borderColor=css('--line');
      Chart.defaults.font.family=getComputedStyle(document.body).fontFamily;

      const today=last.measured_at.slice(0,10);
      const rows=hourly.filter(r=>r.measured_at.startsWith(today));
      new Chart($('c1'),{type:'line',data:{labels:rows.map(r=>r.measured_at.slice(11,16)),datasets:[
        {label:'PM2.5',data:rows.map(r=>r.pm25??null),borderColor:'#e4572e',backgroundColor:'#e4572e',tension:.3,pointRadius:2},
        {label:'PM10',data:rows.map(r=>r.pm10??null),borderColor:'#3b82f6',backgroundColor:'#3b82f6',tension:.3,pointRadius:2}]},
        options:{responsive:true,maintainAspectRatio:false,interaction:{mode:'index',intersect:false},
          scales:{y:{beginAtZero:true,title:{display:true,text:'µg/m³'}}}}});

      let usedRolling=false;
      const days=daily.slice(-7).map(r=>{
        let a=r.aqi;
        if(a==null&&r.day===today&&live){a=live.aqi;usedRolling=true}
        return {label:r.day===today?'Today':r.day.slice(5),a};
      });
      new Chart($('c2'),{type:'bar',data:{labels:days.map(x=>x.label),datasets:[{label:'AQI',data:days.map(x=>x.a??null),
          backgroundColor:days.map(x=>(cat(x.a)||[0,0,'#8a8f98'])[2]),borderRadius:4}]},
        options:{responsive:true,maintainAspectRatio:false,
          plugins:{legend:{display:false},tooltip:{callbacks:{afterLabel:ctx=>(cat(ctx.parsed.y)||[])[1]||''}}},
          scales:{y:{beginAtZero:true,suggestedMax:100,title:{display:true,text:'AQI'}}}}});
      if(usedRolling)$('note').textContent="Today's bar shows the rolling 24-hour index until 18 hours of data are in.";
    }

    fetch('data.json',{cache:'no-cache'})
      .then(r=>{if(!r.ok)throw new Error('HTTP '+r.status);return r.json()})
      .then(render)
      .catch(e=>{$('cat').textContent='Data unavailable';$('advice').textContent='Could not load data.json ('+e.message+'). Check that the pipeline has written it.'});

    setTimeout(()=>location.reload(),600000);
    </script>
    </body>
    </html>
- Create a CloudFront distribution:
Go to CloudFront > Distributions > Create distribution. Choose the free plan. Give it a name. Click Next. Choose Amazon S3 as the Origin type. Choose your dashboard S3 bucket as the S3 origin. Do NOT use website endpoint. Click Next. Click Next. Finally, Create distribution.
Once it is created, click edit Settings and set Default root object as “index.html”, Save changes.
Your bucket policy for the dashboard S3 bucket should look something like:
    {
        "Version": "2012-10-17",
        "Statement": [
            {
                "Sid": "AllowCloudFrontServicePrincipal",
                "Effect": "Allow",
                "Principal": {
                    "Service": "cloudfront.amazonaws.com"
                },
                "Action": "s3:GetObject",
                "Resource": "arn:aws:s3:::YOUR_DASHBOARD_BUCKET_NAME/*",
                "Condition": {
                    "ArnLike": {
                        "AWS:SourceArn": "YOUR_CLOUDFRONT_DIST_ARN"
                    }
                }
            }
        ]
    }
- Access your dashboard: Under your CloudFront distribution, you will find your Distribution domain name, copy that URL and open it from your browser.
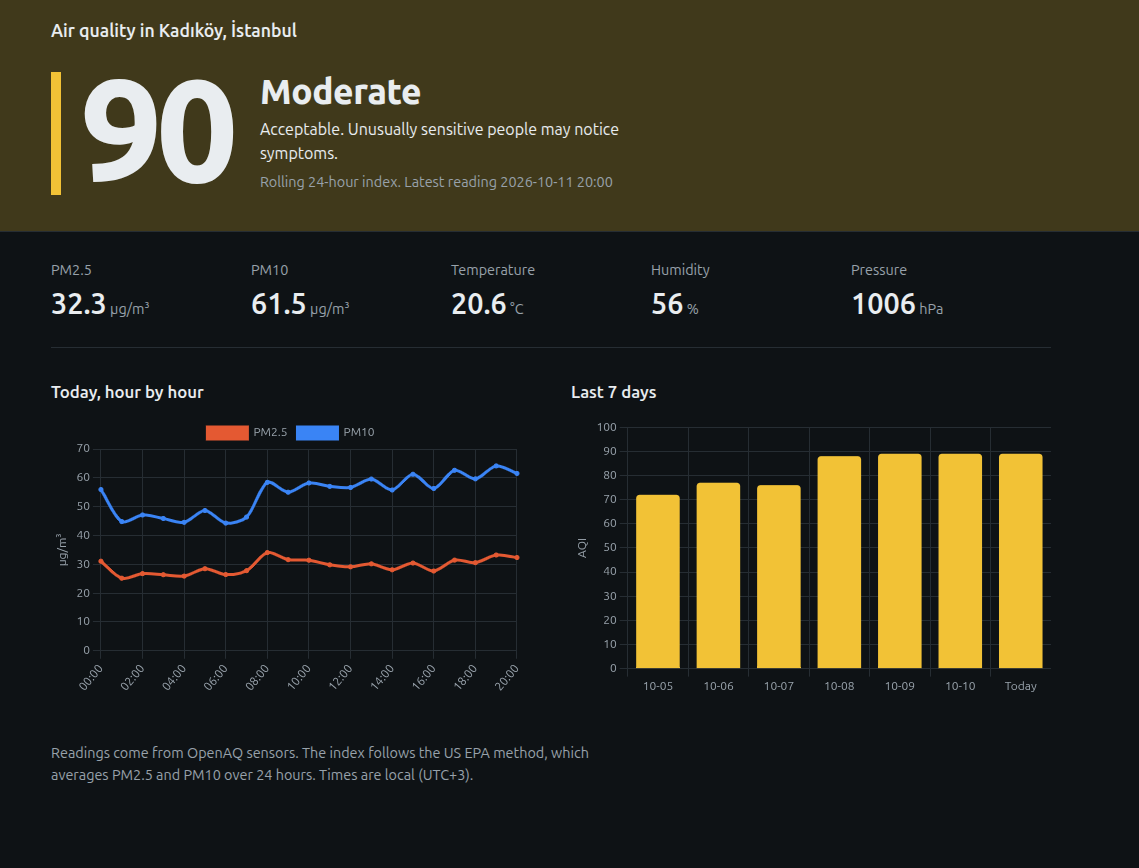
Credits: This project was heavily inspired by the excellent tutorial from https://youtube.com/@selmanay?si=pFXV-_ZJryOr6bIP on YouTube.